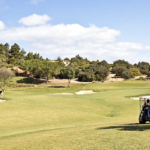
More from Charco del Palo
Slide and Tap Other Months
-
 What is Average Temperature?
The average high temperature and the average low temperature for that month, on a daily basis, divided by 2 equals the average temperature for that month
Temperature
25°C77°F -
 What is Average High Low Temperature?
The sum of high temperatures/low temperatures divided by the number of days in that month, recorded daily
High Temperature
28°C82°F -
 What is Average High Low Temperature?
The sum of high temperatures/low temperatures divided by the number of days in that month, recorded daily
Low Temperature
21°C70°F -
 What is Average Sea Temperature?
Average daily sea temperatures and divided by the number of days in the month. Sea Temperatures are taken from buoys, ships and even satellites can calculate sea temperature based on energy that is radiated from the sea's surface
Sea Temperature
22°C72°F -
 What is Average Rainfall?
The amount of mm in rain for that month divided by the number of days, and the number of days that it rains during that month on average, over a given period of years
Rainfall
0 mm
Sun
Mon
Tue
Wed
Thu
Fri
Sat
1
Avg
25º
77º
2

25º
77º
3
25º
77º
4
24º
75º
5
23º
73º
6
23º
73º
7
23º
73º
8
24º
75º
August 02nd
21:23
-
22
72

22:00
-
22
72
23:00
- Monday
-
22
72
0:00
-
22
72
1:00
-
22
72
2:00
-
22
72

3:00
-
21
70
4:00
-
21
70
5:00
-
21
70
6:00
-
21
70
7:00
-

07:15
-
21
70

8:00
-
23
73
9:00
-
24
75
10:00
-
26
79
11:00
-
26
79
12:00
-
26
79
13:00
-
26
79
14:00
-
26
79
15:00
-
26
79
16:00
-
26
79
17:00
-
26
79
18:00
-
24
75
19:00
-
24
75
20:00
-

20:45
-
23
73
21:00
-
22:00
22º
72º
-
23:00
22º
72º
-
00:00
Mon
22º
72º
-
01:00
22º
72º
-
02:00
22º
72º
-
03:00
21º
70º
-
04:00
21º
70º
-
05:00
21º
70º
-
06:00
21º
70º
-
07:00
21º
70º
-
08:00
21º
70º
-
09:00
23º
73º
-
10:00
24º
75º
-
11:00
25º
77º
-
12:00
26º
79º
-
13:00
26º
79º
-
14:00
26º
79º
-
15:00
25º
77º
-
16:00
25º
77º
-
17:00
25º
77º
-
18:00
25º
77º
-
19:00
24º
75º
-
20:00
23º
73º
-
21:00
22º
72º
07 15
20 45
August 03rd
-
21
70
7:00
-
07:15
-
21
70
8:00
-
23
73
9:00
-
24
75
10:00
-
25
77
11:00
-
26
79
12:00
-
26
79
13:00
-
26
79
14:00
-
25
77
15:00
-
25
77
16:00
-
25
77
17:00
-
25
77
18:00
-
24
75
19:00
-
23
73
20:00
-
20:44
-
22
72
21:00
-
22
72
22:00
-
22
72
23:00
- Tuesday
-
22
72
0:00
-
22
72
1:00
-
22
72
2:00
-
21
70
3:00
-
21
70
4:00
-
21
70
5:00
-
21
70
6:00
-
06:00
21º
70º
-
07:00
21º
70º
-
08:00
21º
70º
-
09:00
23º
73º
-
10:00
24º
75º
-
11:00
25º
77º
-
12:00
26º
79º
-
13:00
26º
79º
-
14:00
26º
79º
-
15:00
25º
77º
-
16:00
25º
77º
-
17:00
25º
77º
-
18:00
25º
77º
-
19:00
24º
75º
-
20:00
23º
73º
-
21:00
22º
72º
-
22:00
22º
72º
-
23:00
22º
72º
-
00:00
Tue
22º
72º
-
01:00
22º
72º
-
02:00
22º
72º
-
03:00
21º
70º
-
04:00
21º
70º
-
05:00
21º
70º
07 15
20 44
August 04th
-
21
70
7:00
-
07:16
-
21
70
8:00
-
23
73
9:00
-
24
75
10:00
-
24
75
11:00
-
25
77
12:00
-
25
77
13:00
-
25
77
14:00
-
25
77
15:00
-
25
77
16:00
-
25
77
17:00
-
24
75
18:00
-
24
75
19:00
-
23
73
20:00
-
20:43
-
22
72
21:00
-
22
72
22:00
-
22
72
23:00
- Wednesday
-
22
72
0:00
-
22
72
1:00
-
22
72
2:00
-
21
70
3:00
-
21
70
4:00
-
21
70
5:00
-
21
70
6:00
-
06:00
21º
70º
-
07:00
21º
70º
-
08:00
21º
70º
-
09:00
23º
73º
-
10:00
24º
75º
-
11:00
24º
75º
-
12:00
25º
77º
-
13:00
25º
77º
-
14:00
25º
77º
-
15:00
25º
77º
-
16:00
25º
77º
-
17:00
25º
77º
-
18:00
24º
75º
-
19:00
24º
75º
-
20:00
23º
73º
-
21:00
22º
72º
-
22:00
22º
72º
-
23:00
22º
72º
-
00:00
Wed
22º
72º
-
01:00
22º
72º
-
02:00
22º
72º
-
03:00
22º
72º
-
04:00
22º
72º
-
05:00
22º
72º
07 16
20 43
August 05th
-
21
70
7:00
-
07:16
-
22
72
8:00
-
22
72
9:00
-
23
73
10:00
-
23
73
11:00
-
24
75
12:00
-
24
75
13:00
-
24
75
14:00
-
24
75
15:00
-
24
75
16:00
-
24
75
17:00
-
24
75
18:00
-
23
73
19:00
-
23
73
20:00
-
20:42
-
22
72
21:00
-
22
72
22:00
-
22
72
23:00
- Thursday
-
22
72
0:00
-
22
72
1:00
-
22
72
2:00
-
22
72
3:00
-
22
72
4:00
-
22
72
5:00
-
22
72
6:00
-
06:00
22º
72º
-
07:00
21º
70º
-
08:00
22º
72º
-
09:00
22º
72º
-
10:00
23º
73º
-
11:00
23º
73º
-
12:00
24º
75º
-
13:00
24º
75º
-
14:00
24º
75º
-
15:00
24º
75º
-
16:00
24º
75º
-
17:00
24º
75º
-
18:00
24º
75º
-
19:00
23º
73º
-
20:00
23º
73º
-
21:00
22º
72º
-
22:00
22º
72º
-
23:00
22º
72º
-
00:00
Thu
22º
72º
-
01:00
21º
70º
-
02:00
21º
70º
-
03:00
21º
70º
-
04:00
21º
70º
-
05:00
21º
70º
07 16
20 42
August 06th
-
21
70
7:00
-
07:17
-
21
70
8:00
-
22
72
9:00
-
23
73
10:00
-
23
73
11:00
-
23
73
12:00
-
24
75
13:00
-
24
75
14:00
-
24
75
15:00
-
24
75
16:00
-
23
73
17:00
-
23
73
18:00
-
23
73
19:00
-
22
72
20:00
-
20:42
-
22
72
21:00
-
21
70
22:00
-
21
70
23:00
- Friday
-
22
72
0:00
-
21
70
1:00
-
21
70
2:00
-
21
70
3:00
-
21
70
4:00
-
21
70
5:00
-
21
70
6:00
-
06:00
21º
70º
-
07:00
21º
70º
-
08:00
21º
70º
-
09:00
22º
72º
-
10:00
23º
73º
-
11:00
23º
73º
-
12:00
23º
73º
-
13:00
24º
75º
-
14:00
24º
75º
-
15:00
24º
75º
-
16:00
24º
75º
-
17:00
23º
73º
-
18:00
23º
73º
-
19:00
23º
73º
-
20:00
22º
72º
-
21:00
22º
72º
-
22:00
21º
70º
-
23:00
21º
70º
-
00:00
Fri
21º
70º
-
01:00
21º
70º
-
02:00
21º
70º
-
03:00
21º
70º
-
04:00
21º
70º
-
05:00
21º
70º
07 17
20 42
August 07th
-
20
68
7:00
-
07:18
-
21
70
8:00
-
22
72
9:00
-
22
72
10:00
-
23
73
11:00
-
23
73
12:00
-
24
75
13:00
-
24
75
14:00
-
24
75
15:00
-
24
75
16:00
-
24
75
17:00
-
23
73
18:00
-
23
73
19:00
-
23
73
20:00
-
20:41
-
22
72
21:00
-
22
72
22:00
-
21
70
23:00
- Saturday
-
21
70
0:00
-
21
70
1:00
-
21
70
2:00
-
21
70
3:00
-
21
70
4:00
-
21
70
5:00
-
21
70
6:00
-
06:00
21º
70º
-
07:00
20º
68º
-
08:00
21º
70º
-
09:00
22º
72º
-
10:00
22º
72º
-
11:00
23º
73º
-
12:00
23º
73º
-
13:00
24º
75º
-
14:00
24º
75º
-
15:00
24º
75º
-
16:00
24º
75º
-
17:00
24º
75º
-
18:00
23º
73º
-
19:00
23º
73º
-
20:00
23º
73º
-
21:00
22º
72º
-
22:00
22º
72º
-
23:00
21º
70º
-
00:00
Sat
21º
70º
-
01:00
21º
70º
-
02:00
21º
70º
-
03:00
21º
70º
-
04:00
21º
70º
-
05:00
21º
70º
07 18
20 41
August 08th
-
21
70
7:00
-
07:18
-
22
72
8:00
-
23
73
9:00
-
23
73
10:00
-
24
75
11:00
-
24
75
12:00
-
25
77
13:00
-
25
77
14:00
-
25
77
15:00
-
25
77
16:00
-
25
77
17:00
-
24
75
18:00
-
24
75
19:00
-
23
73
20:00
-
20:40
-
23
73
21:00
-
22
72
22:00
-
22
72
23:00
- Sunday
-
21
70
0:00
-
21
70
1:00
-
21
70
2:00
-
21
70
3:00
-
21
70
4:00
-
21
70
5:00
-
21
70
6:00
-
06:00
21º
70º
-
07:00
21º
70º
-
08:00
22º
72º
-
09:00
23º
73º
-
10:00
23º
73º
-
11:00
24º
75º
-
12:00
24º
75º
-
13:00
25º
77º
-
14:00
25º
77º
-
15:00
25º
77º
-
16:00
25º
77º
-
17:00
25º
77º
-
18:00
24º
75º
-
19:00
24º
75º
-
20:00
23º
73º
-
21:00
23º
73º
-
22:00
22º
72º
-
23:00
22º
72º
-
00:00
Sun
22º
72º
-
01:00
22º
72º
-
02:00
22º
72º
-
03:00
22º
72º
-
04:00
21º
70º
-
05:00
21º
70º
07 18
20 40
9
24º
75º
10
23º
73º
11
23º
73º
12
23º
73º
13
24º
75º
14
26º
79º
15
23º
73º
August 09th
-
21
70
7:00
-
07:19
-
22
72
8:00
-
23
73
9:00
-
23
73
10:00
-
24
75
11:00
-
24
75
12:00
-
24
75
13:00
-
25
77
14:00
-
25
77
15:00
-
25
77
16:00
-
24
75
17:00
-
24
75
18:00
-
23
73
19:00
-
23
73
20:00
-
20:39
-
22
72
21:00
-
22
72
22:00
-
22
72
23:00
- Monday
-
22
72
0:00
-
22
72
1:00
-
22
72
2:00
-
22
72
3:00
-
21
70
4:00
-
21
70
5:00
-
21
70
6:00
-
06:00
21º
70º
-
07:00
21º
70º
-
08:00
22º
72º
-
09:00
23º
73º
-
10:00
23º
73º
-
11:00
24º
75º
-
12:00
24º
75º
-
13:00
24º
75º
-
14:00
25º
77º
-
15:00
25º
77º
-
16:00
25º
77º
-
17:00
24º
75º
-
18:00
24º
75º
-
19:00
23º
73º
-
20:00
23º
73º
-
21:00
22º
72º
-
22:00
22º
72º
-
23:00
22º
72º
-
00:00
Mon
22º
72º
-
01:00
21º
70º
-
02:00
21º
70º
-
03:00
21º
70º
-
04:00
21º
70º
-
05:00
21º
70º
07 19
20 39
August 10th
-
21
70
7:00
-
07:19
-
21
70
8:00
-
22
72
9:00
-
22
72
10:00
-
23
73
11:00
-
23
73
12:00
-
23
73
13:00
-
24
75
14:00
-
24
75
15:00
-
24
75
16:00
-
23
73
17:00
-
23
73
18:00
-
22
72
19:00
-
22
72
20:00
-
20:38
-
22
72
21:00
-
21
70
22:00
-
21
70
23:00
- Tuesday
-
22
72
0:00
-
21
70
1:00
-
21
70
2:00
-
21
70
3:00
-
21
70
4:00
-
21
70
5:00
-
21
70
6:00
-
06:00
21º
70º
-
07:00
21º
70º
-
08:00
21º
70º
-
09:00
22º
72º
-
10:00
22º
72º
-
11:00
23º
73º
-
12:00
23º
73º
-
13:00
23º
73º
-
14:00
24º
75º
-
15:00
24º
75º
-
16:00
24º
75º
-
17:00
23º
73º
-
18:00
23º
73º
-
19:00
22º
72º
-
20:00
22º
72º
-
21:00
22º
72º
-
22:00
21º
70º
-
23:00
21º
70º
-
00:00
Tue
21º
70º
-
01:00
21º
70º
-
02:00
21º
70º
-
03:00
21º
70º
-
04:00
21º
70º
-
05:00
21º
70º
07 19
20 38
August 11th
-
21
70
7:00
-
07:20
-
21
70
8:00
-
22
72
9:00
-
22
72
10:00
-
23
73
11:00
-
23
73
12:00
-
23
73
13:00
-
23
73
14:00
-
24
75
15:00
-
24
75
16:00
-
23
73
17:00
-
23
73
18:00
-
23
73
19:00
-
22
72
20:00
-
20:37
-
22
72
21:00
-
21
70
22:00
-
21
70
23:00
- Wednesday
-
21
70
0:00
-
21
70
1:00
-
21
70
2:00
-
21
70
3:00
-
21
70
4:00
-
21
70
5:00
-
21
70
6:00
-
06:00
21º
70º
-
07:00
21º
70º
-
08:00
21º
70º
-
09:00
22º
72º
-
10:00
22º
72º
-
11:00
23º
73º
-
12:00
23º
73º
-
13:00
23º
73º
-
14:00
23º
73º
-
15:00
24º
75º
-
16:00
24º
75º
-
17:00
23º
73º
-
18:00
23º
73º
-
19:00
23º
73º
-
20:00
22º
72º
-
21:00
22º
72º
-
22:00
21º
70º
-
23:00
21º
70º
-
00:00
Wed
21º
70º
-
01:00
21º
70º
-
02:00
21º
70º
-
03:00
21º
70º
-
04:00
21º
70º
-
05:00
21º
70º
07 20
20 37
August 12th
-
21
70
7:00
-
07:20
-
21
70
8:00
-
22
72
9:00
-
22
72
10:00
-
23
73
11:00
-
23
73
12:00
-
24
75
13:00
-
24
75
14:00
-
24
75
15:00
-
24
75
16:00
-
24
75
17:00
-
23
73
18:00
-
23
73
19:00
-
23
73
20:00
-
20:36
-
22
72
21:00
-
22
72
22:00
-
22
72
23:00
- Thursday
-
21
70
0:00
-
21
70
1:00
-
21
70
2:00
-
21
70
3:00
-
21
70
4:00
-
21
70
5:00
-
21
70
6:00
-
06:00
21º
70º
-
07:00
21º
70º
-
08:00
21º
70º
-
09:00
22º
72º
-
10:00
22º
72º
-
11:00
23º
73º
-
12:00
23º
73º
-
13:00
24º
75º
-
14:00
24º
75º
-
15:00
24º
75º
-
16:00
24º
75º
-
17:00
24º
75º
-
18:00
23º
73º
-
19:00
23º
73º
-
20:00
23º
73º
-
21:00
22º
72º
-
22:00
22º
72º
-
23:00
22º
72º
-
00:00
Thu
22º
72º
-
01:00
21º
70º
-
02:00
21º
70º
-
03:00
21º
70º
-
04:00
21º
70º
-
05:00
21º
70º
07 20
20 36
August 13th
-
21
70
7:00
-
07:21
-
22
72
8:00
-
23
73
9:00
-
23
73
10:00
-
24
75
11:00
-
24
75
12:00
-
25
77
13:00
-
25
77
14:00
-
25
77
15:00
-
25
77
16:00
-
25
77
17:00
-
25
77
18:00
-
25
77
19:00
-
24
75
20:00
-
20:35
-
23
73
21:00
-
22
72
22:00
-
22
72
23:00
- Friday
-
22
72
0:00
-
21
70
1:00
-
21
70
2:00
-
21
70
3:00
-
21
70
4:00
-
21
70
5:00
-
21
70
6:00
-
06:00
21º
70º
-
07:00
21º
70º
-
08:00
22º
72º
-
09:00
23º
73º
-
10:00
23º
73º
-
11:00
24º
75º
-
12:00
24º
75º
-
13:00
25º
77º
-
14:00
25º
77º
-
15:00
25º
77º
-
16:00
25º
77º
-
17:00
25º
77º
-
18:00
25º
77º
-
19:00
25º
77º
-
20:00
24º
75º
-
21:00
23º
73º
-
22:00
22º
72º
-
23:00
22º
72º
-
00:00
Fri
22º
72º
-
01:00
22º
72º
-
02:00
22º
72º
-
03:00
22º
72º
-
04:00
22º
72º
-
05:00
22º
72º
07 21
20 35
August 14th
-
23
73
7:00
-
07:22
-
24
75
8:00
-
25
77
9:00
-
26
79
10:00
-
26
79
11:00
-
27
81
12:00
-
27
81
13:00
-
27
81
14:00
-
28
82
15:00
-
28
82
16:00
-
27
81
17:00
-
26
79
18:00
-
25
77
19:00
-
25
77
20:00
-
20:35
-
24
75
21:00
-
23
73
22:00
-
23
73
23:00
- Saturday
-
22
72
0:00
-
22
72
1:00
-
22
72
2:00
-
22
72
3:00
-
22
72
4:00
-
22
72
5:00
-
22
72
6:00
-
06:00
22º
72º
-
07:00
23º
73º
-
08:00
24º
75º
-
09:00
25º
77º
-
10:00
26º
79º
-
11:00
26º
79º
-
12:00
27º
81º
-
13:00
27º
81º
-
14:00
27º
81º
-
15:00
28º
82º
-
16:00
28º
82º
-
17:00
27º
81º
-
18:00
26º
79º
-
19:00
25º
77º
-
20:00
25º
77º
-
21:00
24º
75º
-
22:00
23º
73º
-
23:00
23º
73º
-
00:00
Sat
21º
70º
-
01:00
21º
70º
-
02:00
21º
70º
-
03:00
21º
70º
-
04:00
21º
70º
-
05:00
21º
70º
07 22
20 35
August 15th
-
21
70
7:00
-
07:22
-
22
72
8:00
-
22
72
9:00
-
23
73
10:00
-
23
73
11:00
-
23
73
12:00
-
24
75
13:00
-
24
75
14:00
-
24
75
15:00
-
24
75
16:00
-
23
73
17:00
-
23
73
18:00
-
22
72
19:00
-
22
72
20:00
-
20:34
-
21
70
21:00
-
21
70
22:00
-
21
70
23:00
- Sunday
-
21
70
0:00
-
21
70
1:00
-
21
70
2:00
-
21
70
3:00
-
21
70
4:00
-
21
70
5:00
-
21
70
6:00
-
06:00
21º
70º
-
07:00
21º
70º
-
08:00
22º
72º
-
09:00
22º
72º
-
10:00
23º
73º
-
11:00
23º
73º
-
12:00
23º
73º
-
13:00
24º
75º
-
14:00
24º
75º
-
15:00
24º
75º
-
16:00
24º
75º
-
17:00
23º
73º
-
18:00
23º
73º
-
19:00
22º
72º
-
20:00
22º
72º
-
21:00
21º
70º
-
22:00
21º
70º
-
23:00
21º
70º
-
00:00
Sun

21º
70º
-
01:00
21º
70º
-
02:00
21º
70º
-
03:00
21º
70º
-
04:00
21º
70º
-
05:00
21º
70º
07 22
20 34
16
23º
73º
17
23º
73º
18
23º
73º
19
23º
73º
20

23º
73º
21
23º
73º
22
23º
73º
August 16th
-
06:00
21º
70º
-
07:00
22º
72º
-
08:00
22º
72º
-
09:00
22º
72º
-
10:00
23º
73º
-
11:00
23º
73º
-
12:00
24º
75º
-
13:00
24º
75º
-
14:00
24º
75º
-
15:00
24º
75º
-
16:00
24º
75º
-
17:00
24º
75º
-
18:00
23º
73º
-
19:00
23º
73º
-
20:00
22º
72º
-
21:00
22º
72º
-
22:00
22º
72º
-
23:00
22º
72º
-
00:00
Mon
21º
70º
-
01:00
21º
70º
-
02:00
21º
70º
-
03:00
21º
70º
-
04:00
21º
70º
-
05:00
21º
70º
07 23
20 33
August 17th
-
06:00
21º
70º
-
07:00
22º
72º
-
08:00
22º
72º
-
09:00
22º
72º
-
10:00
23º
73º
-
11:00
23º
73º
-
12:00
23º
73º
-
13:00
24º
75º
-
14:00
24º
75º
-
15:00
24º
75º
-
16:00
24º
75º
-
17:00
23º
73º
-
18:00
23º
73º
-
19:00
22º
72º
-
20:00
22º
72º
-
21:00
22º
72º
-
22:00
21º
70º
-
23:00
21º
70º
-
00:00
Tue
21º
70º
-
01:00
21º
70º
-
02:00
21º
70º
-
03:00
21º
70º
-
04:00
21º
70º
-
05:00
21º
70º
07 23
20 32
August 18th
-
06:00
21º
70º
-
07:00
21º
70º
-
08:00
22º
72º
-
09:00
22º
72º
-
10:00
23º
73º
-
11:00
23º
73º
-
12:00
23º
73º
-
13:00
24º
75º
-
14:00
24º
75º
-
15:00
24º
75º
-
16:00
23º
73º
-
17:00
23º
73º
-
18:00
23º
73º
-
19:00
22º
72º
-
20:00
22º
72º
-
21:00
21º
70º
-
22:00
21º
70º
-
23:00
21º
70º
-
00:00
Wed
21º
70º
-
01:00
21º
70º
-
02:00
21º
70º
-
03:00
21º
70º
-
04:00
21º
70º
-
05:00
21º
70º
07 24
20 31
August 19th
-
06:00
21º
70º
-
07:00
21º
70º
-
08:00
22º
72º
-
09:00
22º
72º
-
10:00
22º
72º
-
11:00
23º
73º
-
12:00
23º
73º
-
13:00
24º
75º
-
14:00
24º
75º
-
15:00
24º
75º
-
16:00
24º
75º
-
17:00
23º
73º
-
18:00
23º
73º
-
19:00
22º
72º
-
20:00
22º
72º
-
21:00
21º
70º
-
22:00
21º
70º
-
23:00
21º
70º
-
00:00
Thu
21º
70º
-
01:00
21º
70º
-
02:00
21º
70º
-
03:00
21º
70º
-
04:00
21º
70º
-
05:00
21º
70º
07 24
20 30
August 20th
-
06:00
21º
70º
-
07:00
22º
72º
-
08:00
22º
72º
-
09:00
22º
72º
-
10:00
23º
73º
-
11:00
23º
73º
-
12:00
23º
73º
-
13:00
24º
75º
-
14:00
24º
75º
-
15:00
24º
75º
-
16:00
23º
73º
-
17:00
23º
73º
-
18:00
23º
73º
-
19:00
22º
72º
-
20:00
22º
72º
-
21:00
22º
72º
-
22:00
21º
70º
-
23:00
21º
70º
-
00:00
Fri
21º
70º
-
01:00
21º
70º
-
02:00
21º
70º
-
03:00
21º
70º
-
04:00
21º
70º
-
05:00
21º
70º
07 25
20 29
August 21st
-
06:00
22º
72º
-
07:00
22º
72º
-
08:00
22º
72º
-
09:00
22º
72º
-
10:00
23º
73º
-
11:00
23º
73º
-
12:00
23º
73º
-
13:00
24º
75º
-
14:00
24º
75º
-
15:00
24º
75º
-
16:00
24º
75º
-
17:00
23º
73º
-
18:00
23º
73º
-
19:00
22º
72º
-
20:00
22º
72º
-
21:00
22º
72º
-
22:00
22º
72º
-
23:00
22º
72º
-
00:00
Sat
22º
72º
-
01:00
22º
72º
-
02:00
21º
70º
-
03:00
21º
70º
-
04:00
21º
70º
-
05:00
21º
70º
07 25
20 28
August 22nd
-
06:00
21º
70º
-
07:00
22º
72º
-
08:00
22º
72º
-
09:00
23º
73º
-
10:00
23º
73º
-
11:00
23º
73º
-
12:00
24º
75º
-
13:00
24º
75º
-
14:00
24º
75º
-
15:00
24º
75º
-
16:00
24º
75º
-
17:00
23º
73º
-
18:00
23º
73º
-
19:00
22º
72º
-
20:00
22º
72º
-
21:00
22º
72º
-
22:00
22º
72º
-
23:00
21º
70º
-
00:00
Sun
21º
70º
-
01:00
21º
70º
-
02:00
21º
70º
-
03:00
21º
70º
-
04:00
21º
70º
-
05:00
21º
70º
07 26
20 27
23
23º
73º
24
23º
73º
25
23º
73º
26
23º
73º
27
Avg
26º
79º
28
Avg
25º
77º
29
Avg
26º
79º
August 23rd
-
06:00
21º
70º
-
07:00
22º
72º
-
08:00
22º
72º
-
09:00
22º
72º
-
10:00
23º
73º
-
11:00
23º
73º
-
12:00
23º
73º
-
13:00
24º
75º
-
14:00
24º
75º
-
15:00
24º
75º
-
16:00
24º
75º
-
17:00
23º
73º
-
18:00
23º
73º
-
19:00
22º
72º
-
20:00
22º
72º
-
21:00
22º
72º
-
22:00
22º
72º
-
23:00
21º
70º
-
00:00
Mon
21º
70º
-
01:00
21º
70º
-
02:00
21º
70º
-
03:00
21º
70º
-
04:00
21º
70º
-
05:00
21º
70º
07 26
20 26
August 24th
-
06:00
21º
70º
-
07:00
22º
72º
-
08:00
22º
72º
-
09:00
22º
72º
-
10:00
23º
73º
-
11:00
23º
73º
-
12:00
23º
73º
-
13:00
24º
75º
-
14:00
24º
75º
-
15:00
24º
75º
-
16:00
24º
75º
-
17:00
23º
73º
-
18:00
23º
73º
-
19:00
22º
72º
-
20:00
22º
72º
-
21:00
22º
72º
-
22:00
22º
72º
-
23:00
21º
70º
-
00:00
Tue
21º
70º
-
01:00
21º
70º
-
02:00
21º
70º
-
03:00
21º
70º
-
04:00
21º
70º
-
05:00
22º
72º
07 27
20 24
August 25th
-
06:00
22º
72º
-
07:00
22º
72º
-
08:00
22º
72º
-
09:00
22º
72º
-
10:00
23º
73º
-
11:00
23º
73º
-
12:00
23º
73º
-
13:00
24º
75º
-
14:00
24º
75º
-
15:00
24º
75º
-
16:00
24º
75º
-
17:00
24º
75º
-
18:00
23º
73º
-
19:00
23º
73º
-
20:00
22º
72º
-
21:00
22º
72º
-
22:00
22º
72º
-
23:00
22º
72º
-
00:00
Wed
22º
72º
-
01:00
22º
72º
-
02:00
21º
70º
-
03:00
21º
70º
-
04:00
21º
70º
-
05:00
22º
72º
07 28
20 23
August 26th
-
06:00
22º
72º
-
07:00
22º
72º
-
08:00
22º
72º
-
09:00
23º
73º
-
10:00
23º
73º
-
11:00
23º
73º
-
12:00
24º
75º
-
13:00
24º
75º
-
14:00
24º
75º
-
15:00
24º
75º
-
16:00
24º
75º
-
17:00
24º
75º
-
18:00
23º
73º
-
19:00
23º
73º
-
20:00
22º
72º
-
21:00
22º
72º
-
22:00
22º
72º
-
23:00
22º
72º
07 28
20 22
30
Avg
26º
79º
31
Avg
26º
79º
Avg
Historical Daily Average
Search for your next stay in Charco del Palo
Choose from millions of homes, hotels and other properties all over the world